15 Advanced Image Representation
The purpose of image processing is to extract meaningful information and patterns from images by manipulating them using computer algorithms. Image processing can be used to enhance an image or simply extract information.
Fourier transforms in two dimensions
Just as we used the Fourier transform to analyze how different frequencies contribute to a one-dimensional signal, like an EEG trace, we can apply the same idea to two-dimensional signals—such as images. An image can be thought of as a grid of brightness values (pixels), varying across both horizontal and vertical dimensions. The 2D Fourier transform breaks this grid down into a set of patterns that vary at different spatial frequencies and orientations. In essence, this shows how quickly brightness changes across the image and in which directions. The resulting amplitude spectrum tells us which spatial frequencies are most prominent in the image (are there broad smooth areas, fine details, repeating textures?), and the phase spectrum tells us how those patterns are arranged to form the recognizable image. In fact, phase turns out to be surprisingly important for preserving the structure of the image—without it, the image can become completely unrecognizable. This chapter introduces the 2D Fourier transform and shows how it provides powerful tools for analyzing and manipulating images.
Spatial Frequencies
Consider the series of images below. As you can see, just as the low frequencies of a one-dimensional signal describe things that vary slowly in time, low spatial frequencies capture elements of the picture that vary slowly in space. By contrast, high spatial frequencies capture very minute details such as the cat’s whiskers.
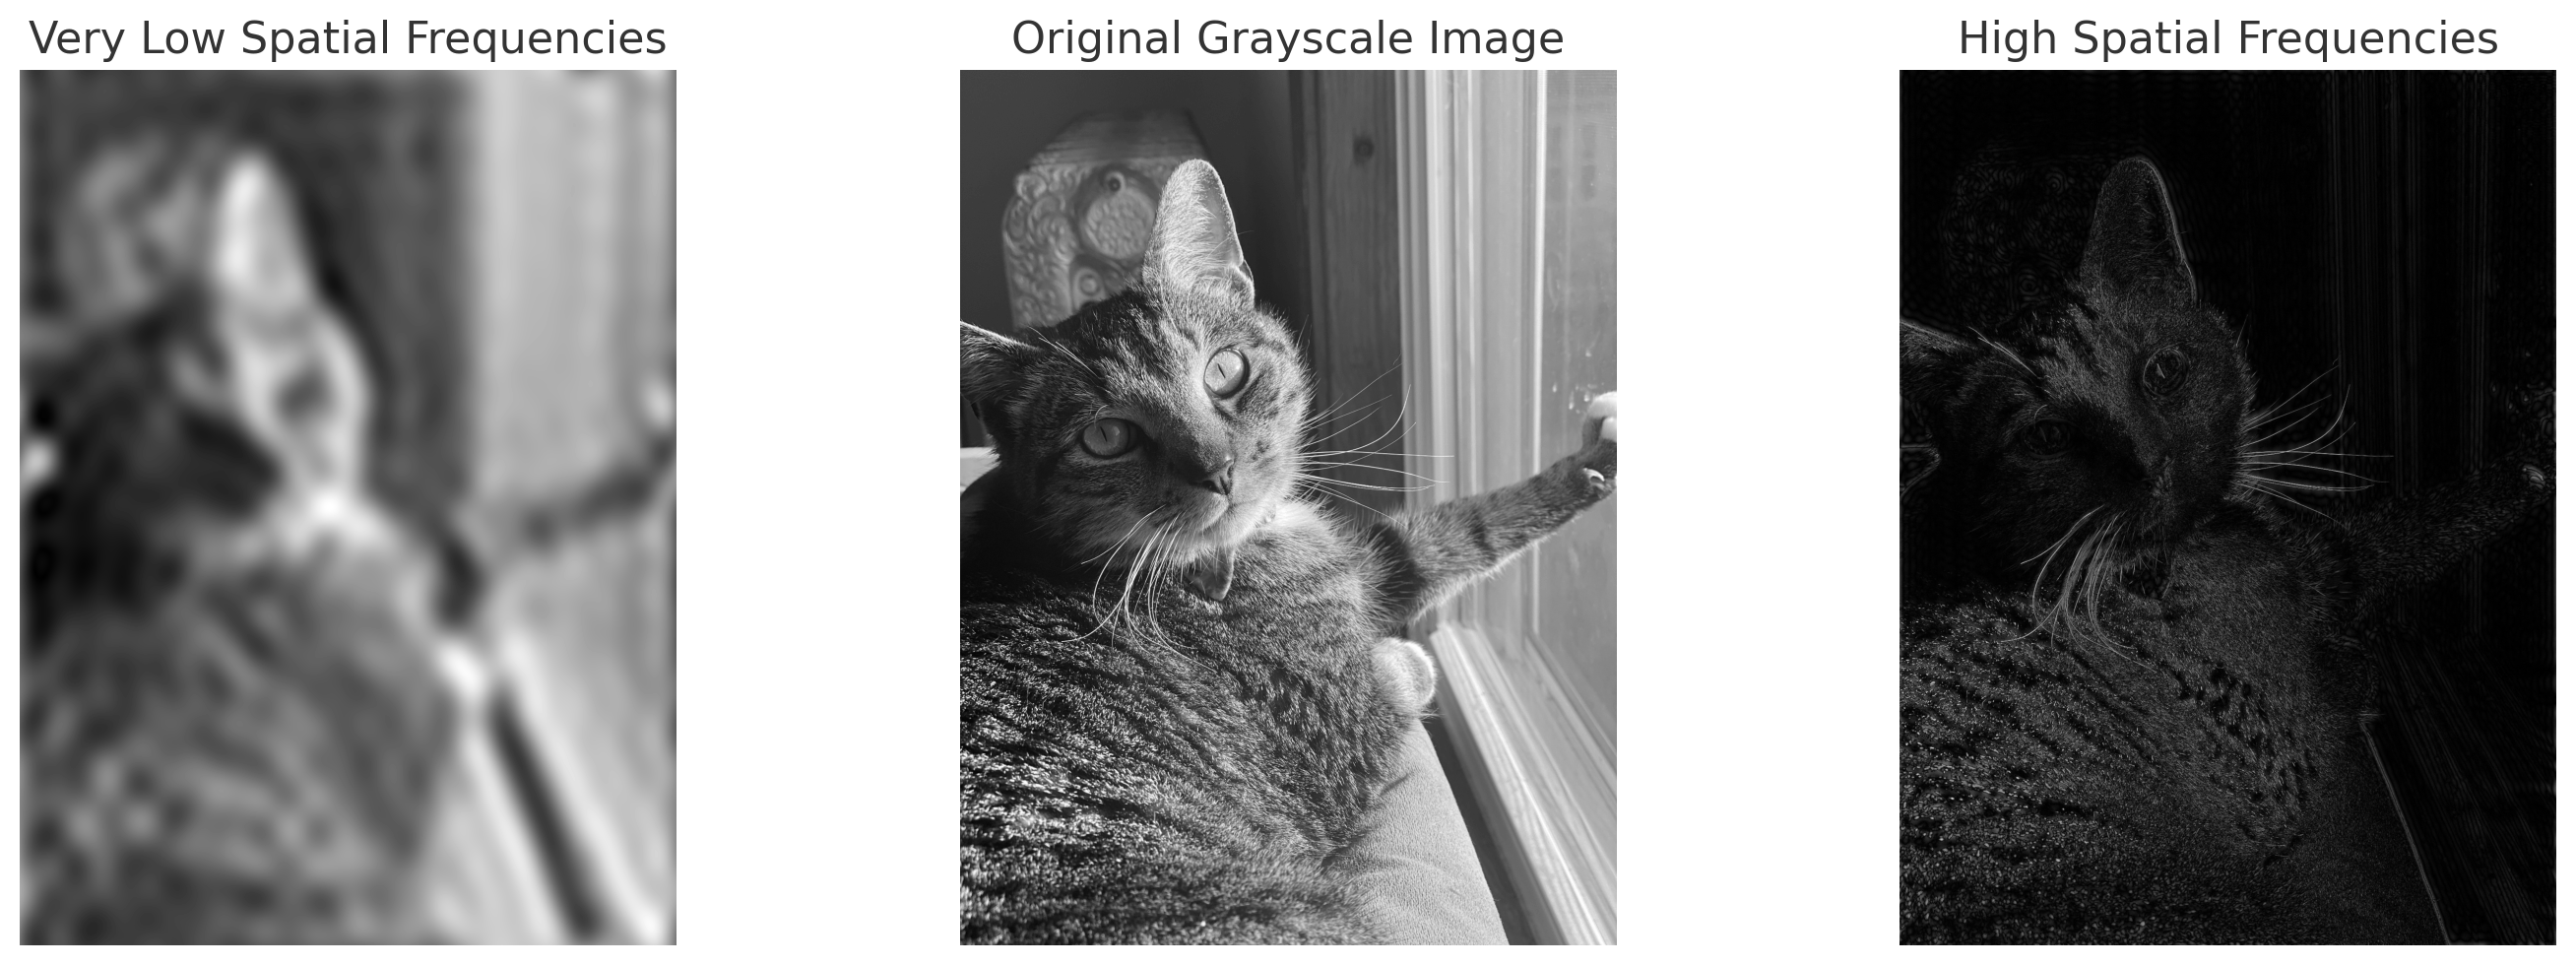
(VCL, 2025)
Amplitude and Phase Spectra of Images
Just like the 1D Fourier transform has an amplitude spectrum and a phase spectrum, so too does the 2D Fourier transform. The amplitude spectrum tells us how much of each spatial frequency is present in the image—whether it is dominated by broad, smooth gradients (low frequencies), fine textures (high frequencies), or patterns at intermediate scales. This gives us a sense of the image’s visual “texture” but not its exact structure. The phase spectrum, on the other hand, tells us how all these frequency components are arranged—essentially encoding the positions and relationships of edges, contours, and shapes. Remarkably, if we keep the phase spectrum but discard the amplitude spectrum, the image often remains recognizable, though it may appear oddly flat or lacking in contrast. If we do the opposite—keeping the amplitude but scrambling the phase—the image becomes an unrecognizable jumble. This shows that while amplitude controls the strength of frequency components, phase carries much of the structural information our visual system uses to interpret images.
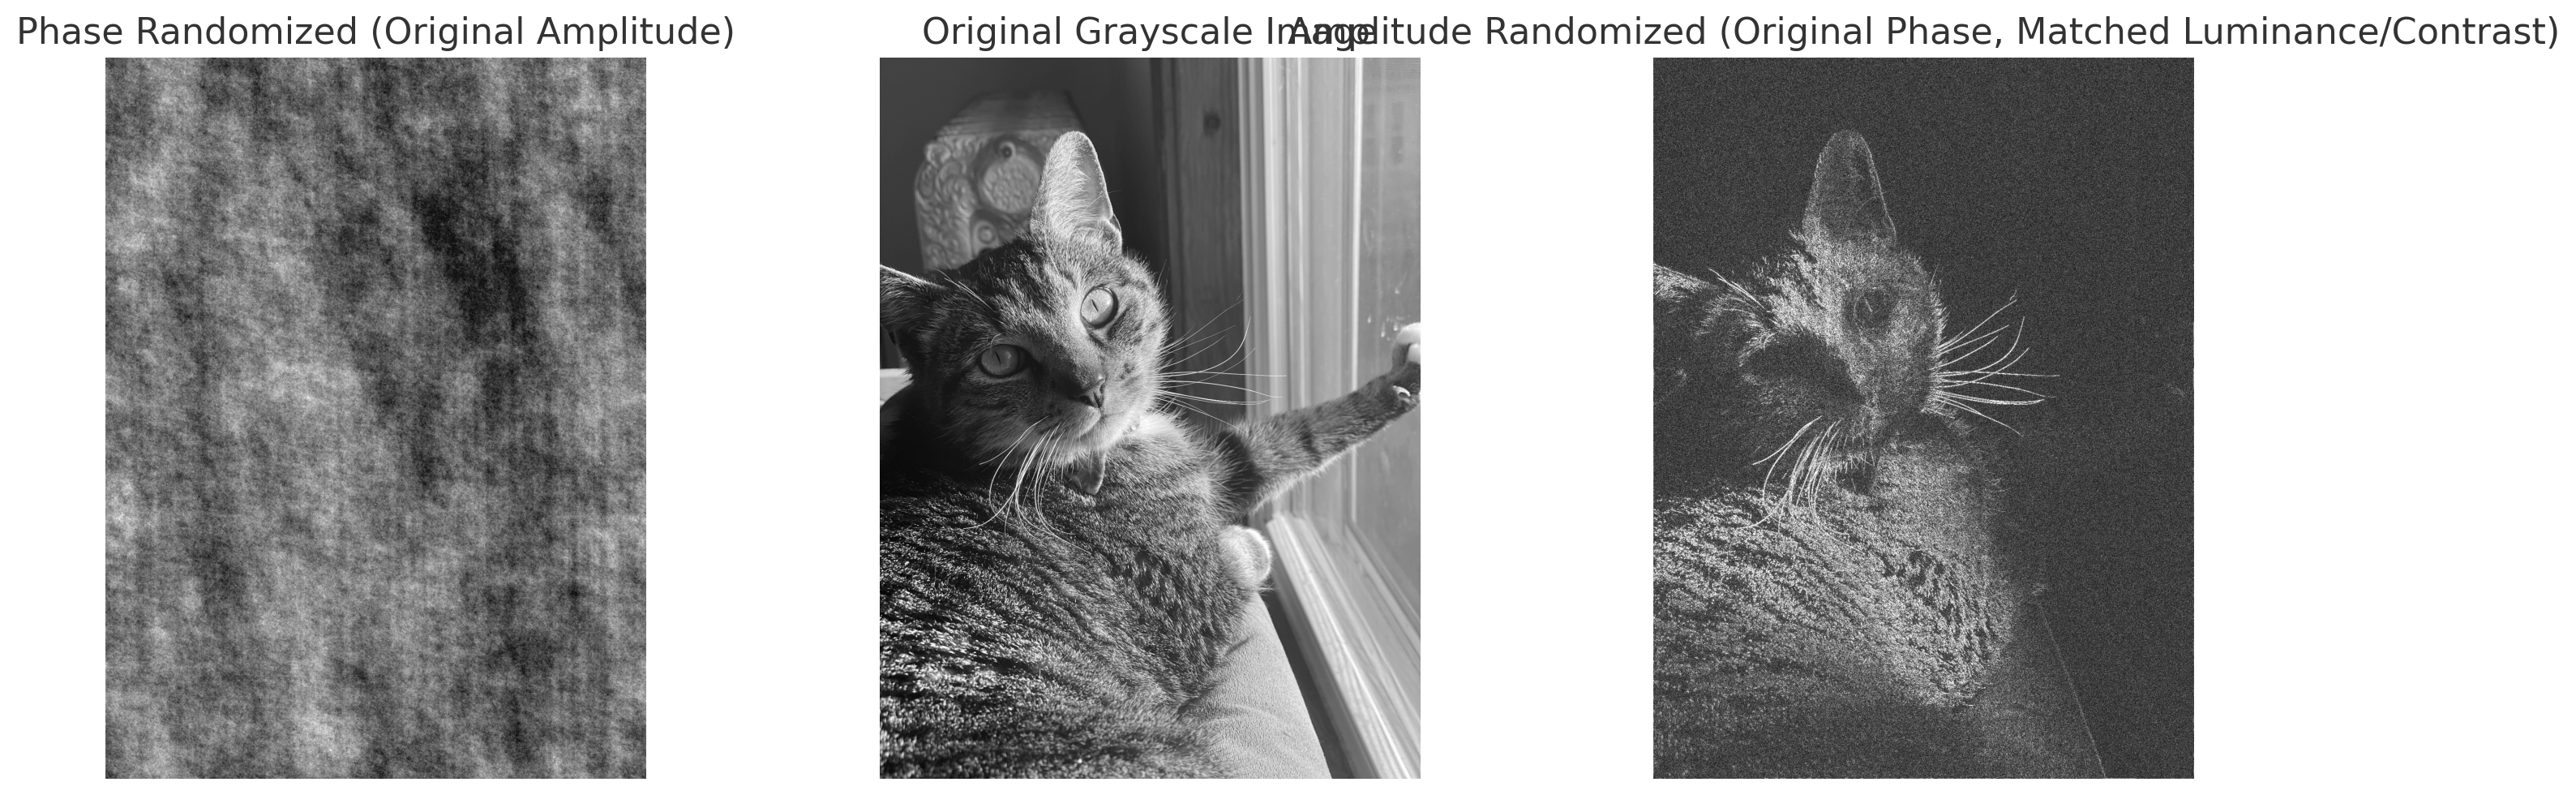 (VCL, 2025)
Phase Randomized Images
Phase randomized images are generated through inverse Fourier transformation. Such images maintain the same amplitude spectrum as the original image but display uniformly distributed noise, making them look less like “real-world” scenes and more like TV static. Phase randomization is used in masking techniques to create stimuli with controlled properties. We can also use partial amounts of the phase spectrum to add some structure.
 (Made in house by VCL 2025)
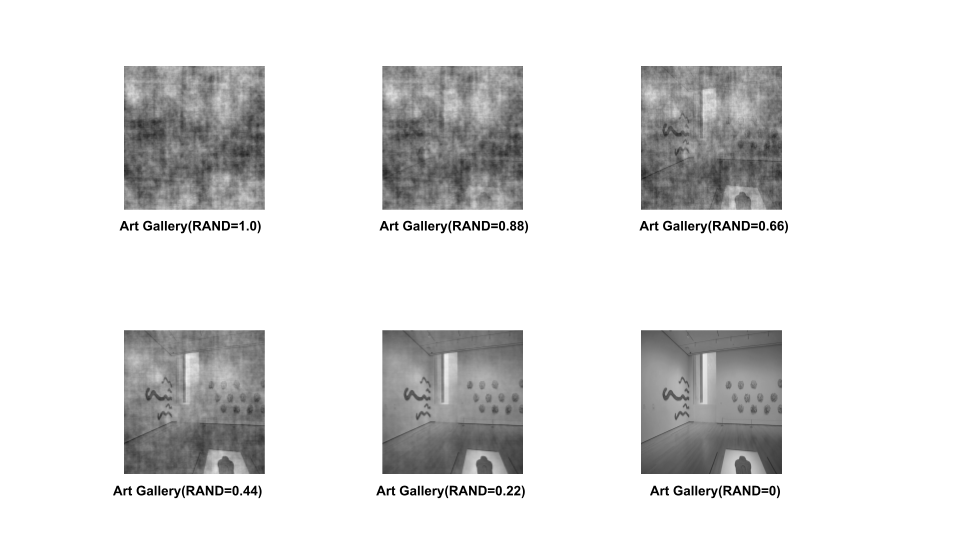
The series of images above show various levels of phase randomization. Art Gallery (RAND = 0) is the original image with no phase randomization. As you view the images from right to left and top to bottom the images get less and less phase randomized and easier to discern. Art Gallery (RAND = 1.0) represents a completely randomized image. It is impossible to determine the scene category of this picture.
Phase randomization is frequently used in our VCL experiments. This technique allows researchers to determine how clear the image needs to become for participants to accurately identify a scene, and measure whether that differs depending on the visual or semantic complexity of the image.
Below are some examples of 0% phase randomized images with their 100% phase randomized counterparts in color:
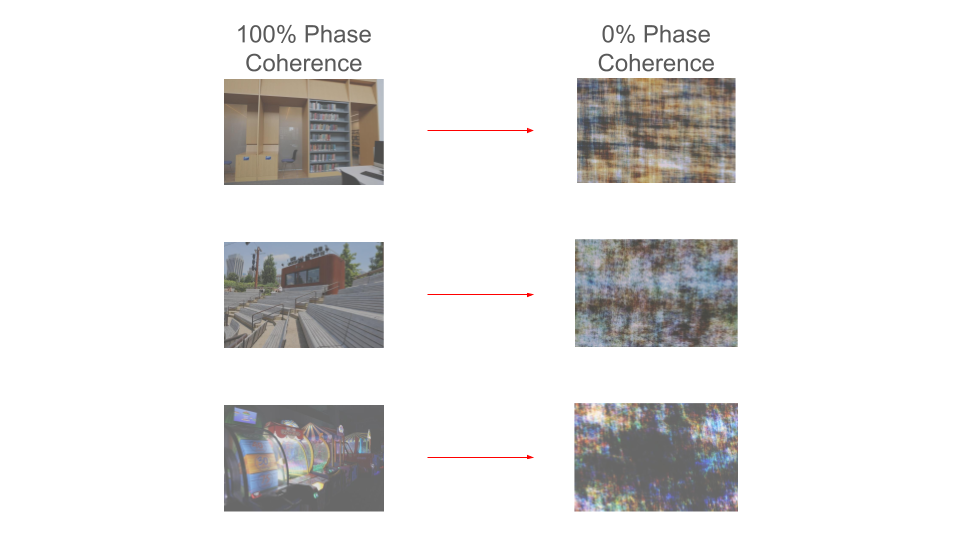 (Made in house by VCL 2025)
Gabor Wavelet
What is a Gabor?
A Gabor is a type of mathematical function that belongs to the [wavelet family](https://en.wikipedia.org/wiki/Wavelet. It is defined by the combination of two fundamental components: a sine wave and a Gaussian function (which is also known as a normal distribution or a bell-shaped curve).
A sine wave extends infinitely from negative to positive infinity.
The Gabor function localizes the sine wave by selecting a finite section of it.
This localization is achieved by multiplying each point of the sine wave by a corresponding value on the Gaussian curve.
As a result, the amplitude of the sine wave is modulated by the shape of the Gaussian distribution.
In other words, a sine wave looks like this:
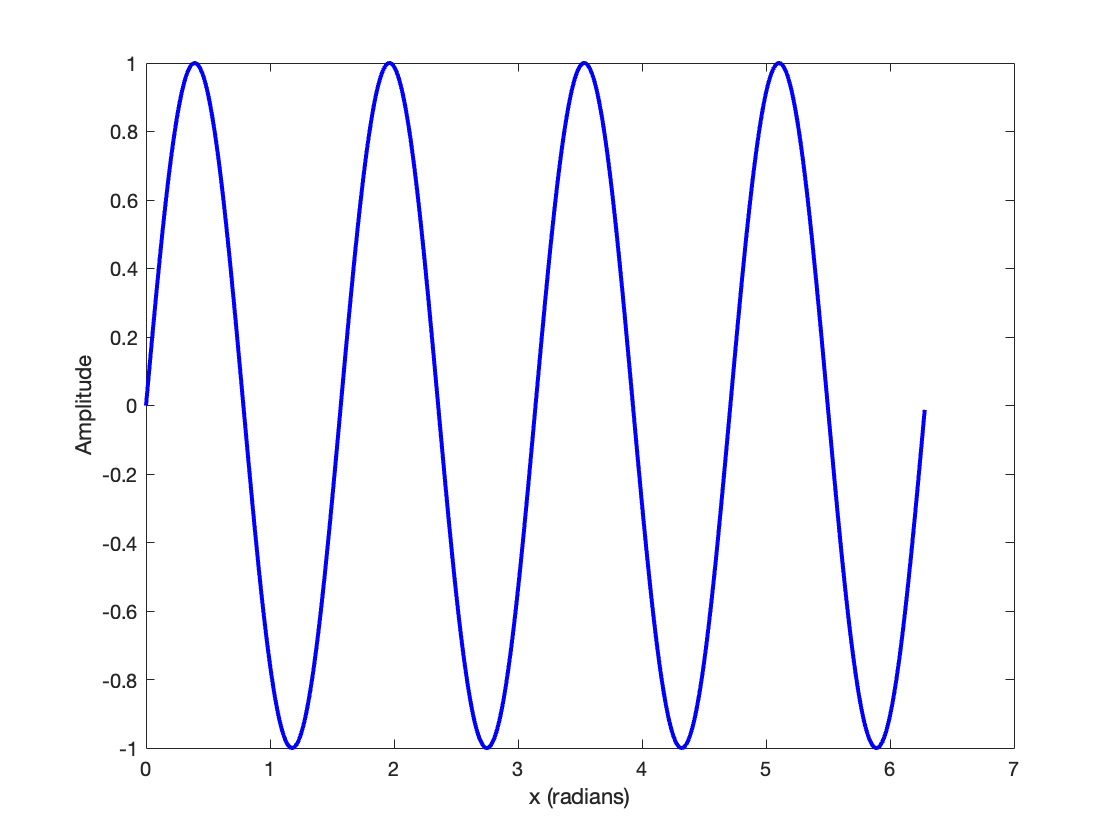 (Made in house by VCL 2025)
And a Gaussian curve (also known as a normal distribution) looks like this:
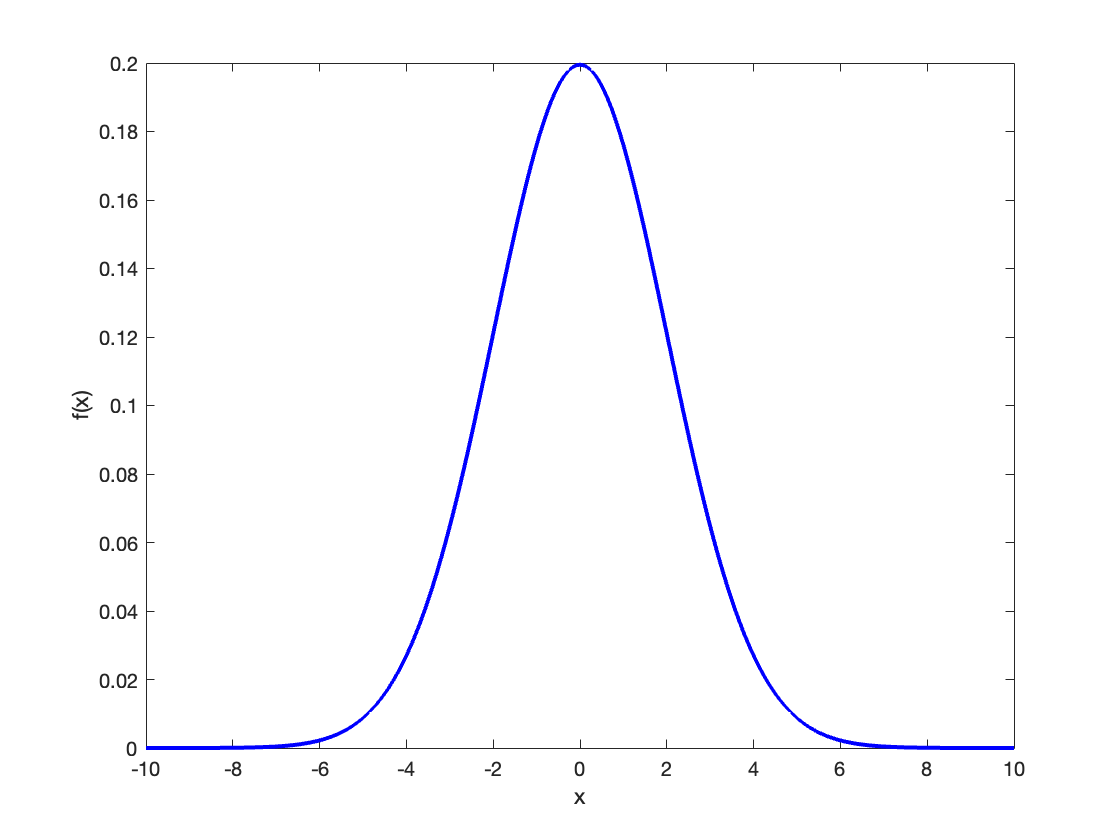 (Made in house by VCL 2025)
Now, if we multiply each point (x-value) on the sine wave by the corresponding point on the Gaussian curve, we get something that looks like this:
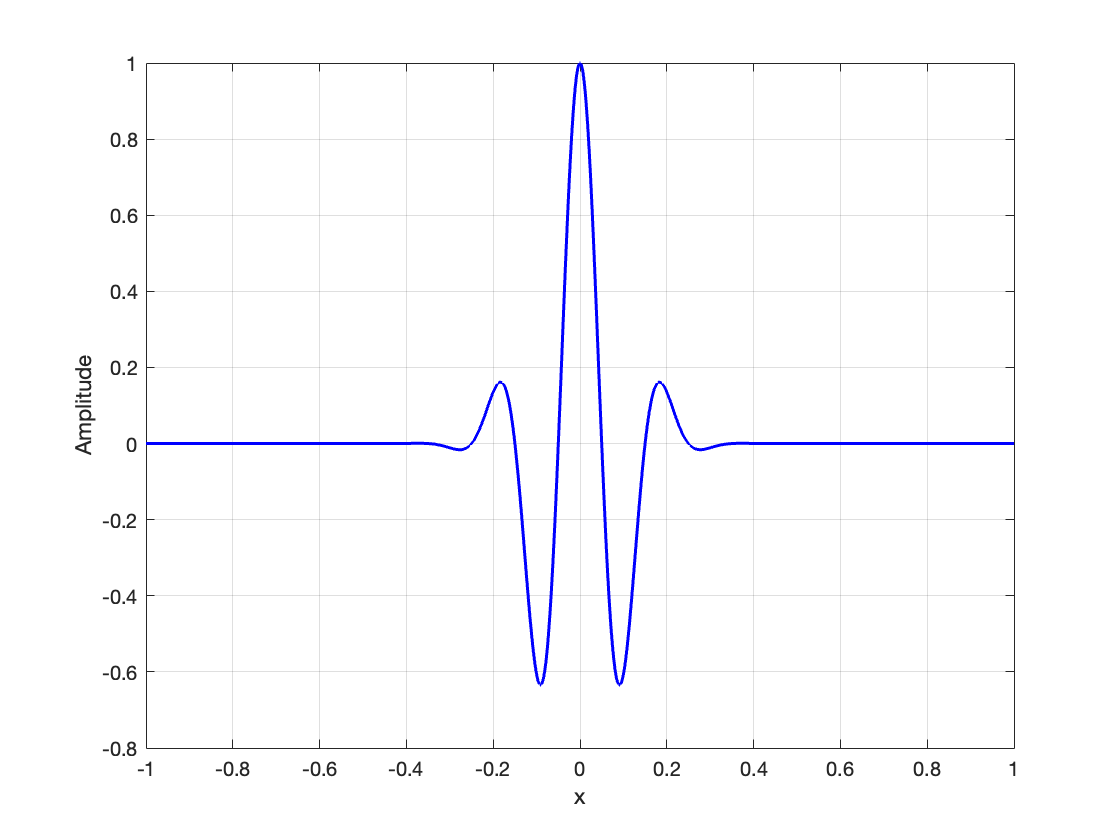 (Made in house by VCL 2025)
In the figure below, we can see this pairwise multiplication process broken down. Notice that the pink dot falls at the same x-value (about 0.1) on all three graphs. On the Gaussian, its y-value is approximately 1.2, and on the sine wave its at y = -1, so when x = 0.1 on the Gabor wavelet, y is about equal to -1.2 (1.2 x -1 = -1.2). The same principal applies to all the other points on the Gaussian and sine wave, resulting in the Gabor shape in the third panel.
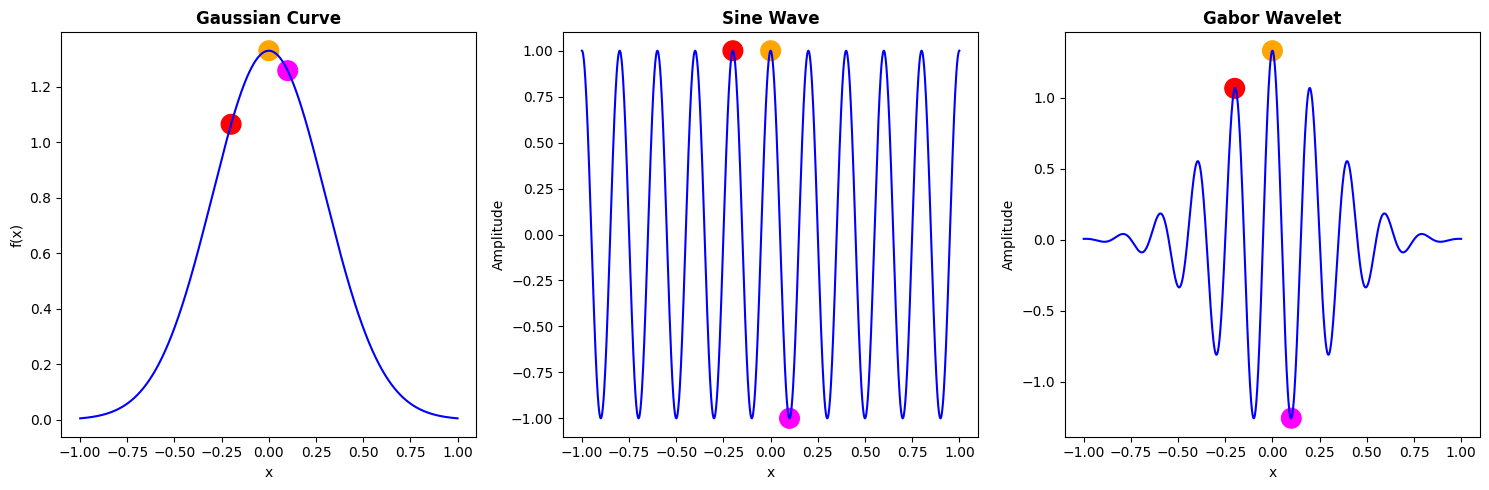 (Made in house by VCL 2025)
The Gabor wavelet goes up and down, like the sine wave, but because it has been multiplied by a Gaussian, which approaches zero at positive and negative infinity, it flattens out on either end, never becoming perfectly flat but getting closer and closer to the x-axis, to the point that we can consider the Gabor contained to a certain range.
This Gabor—formed by the product of the sine wave and the Gaussian—can serve as a filter. The process of applying these filters involves pairwise multiplication, which is known as convolution, a key operation in signal processing and image analysis.
In vision science, Gabors—often referred to as wavelets—are widely used in image processing for detecting edges, textures, and shapes. First, picture the Gabor above in three dimensions instead of two. It would look something like image (c) below, with image (a) representing a sine wave in three dimensions and (b) representing a Gaussian curve in 3D, which are multiplied together to produce the 3D Gabor.
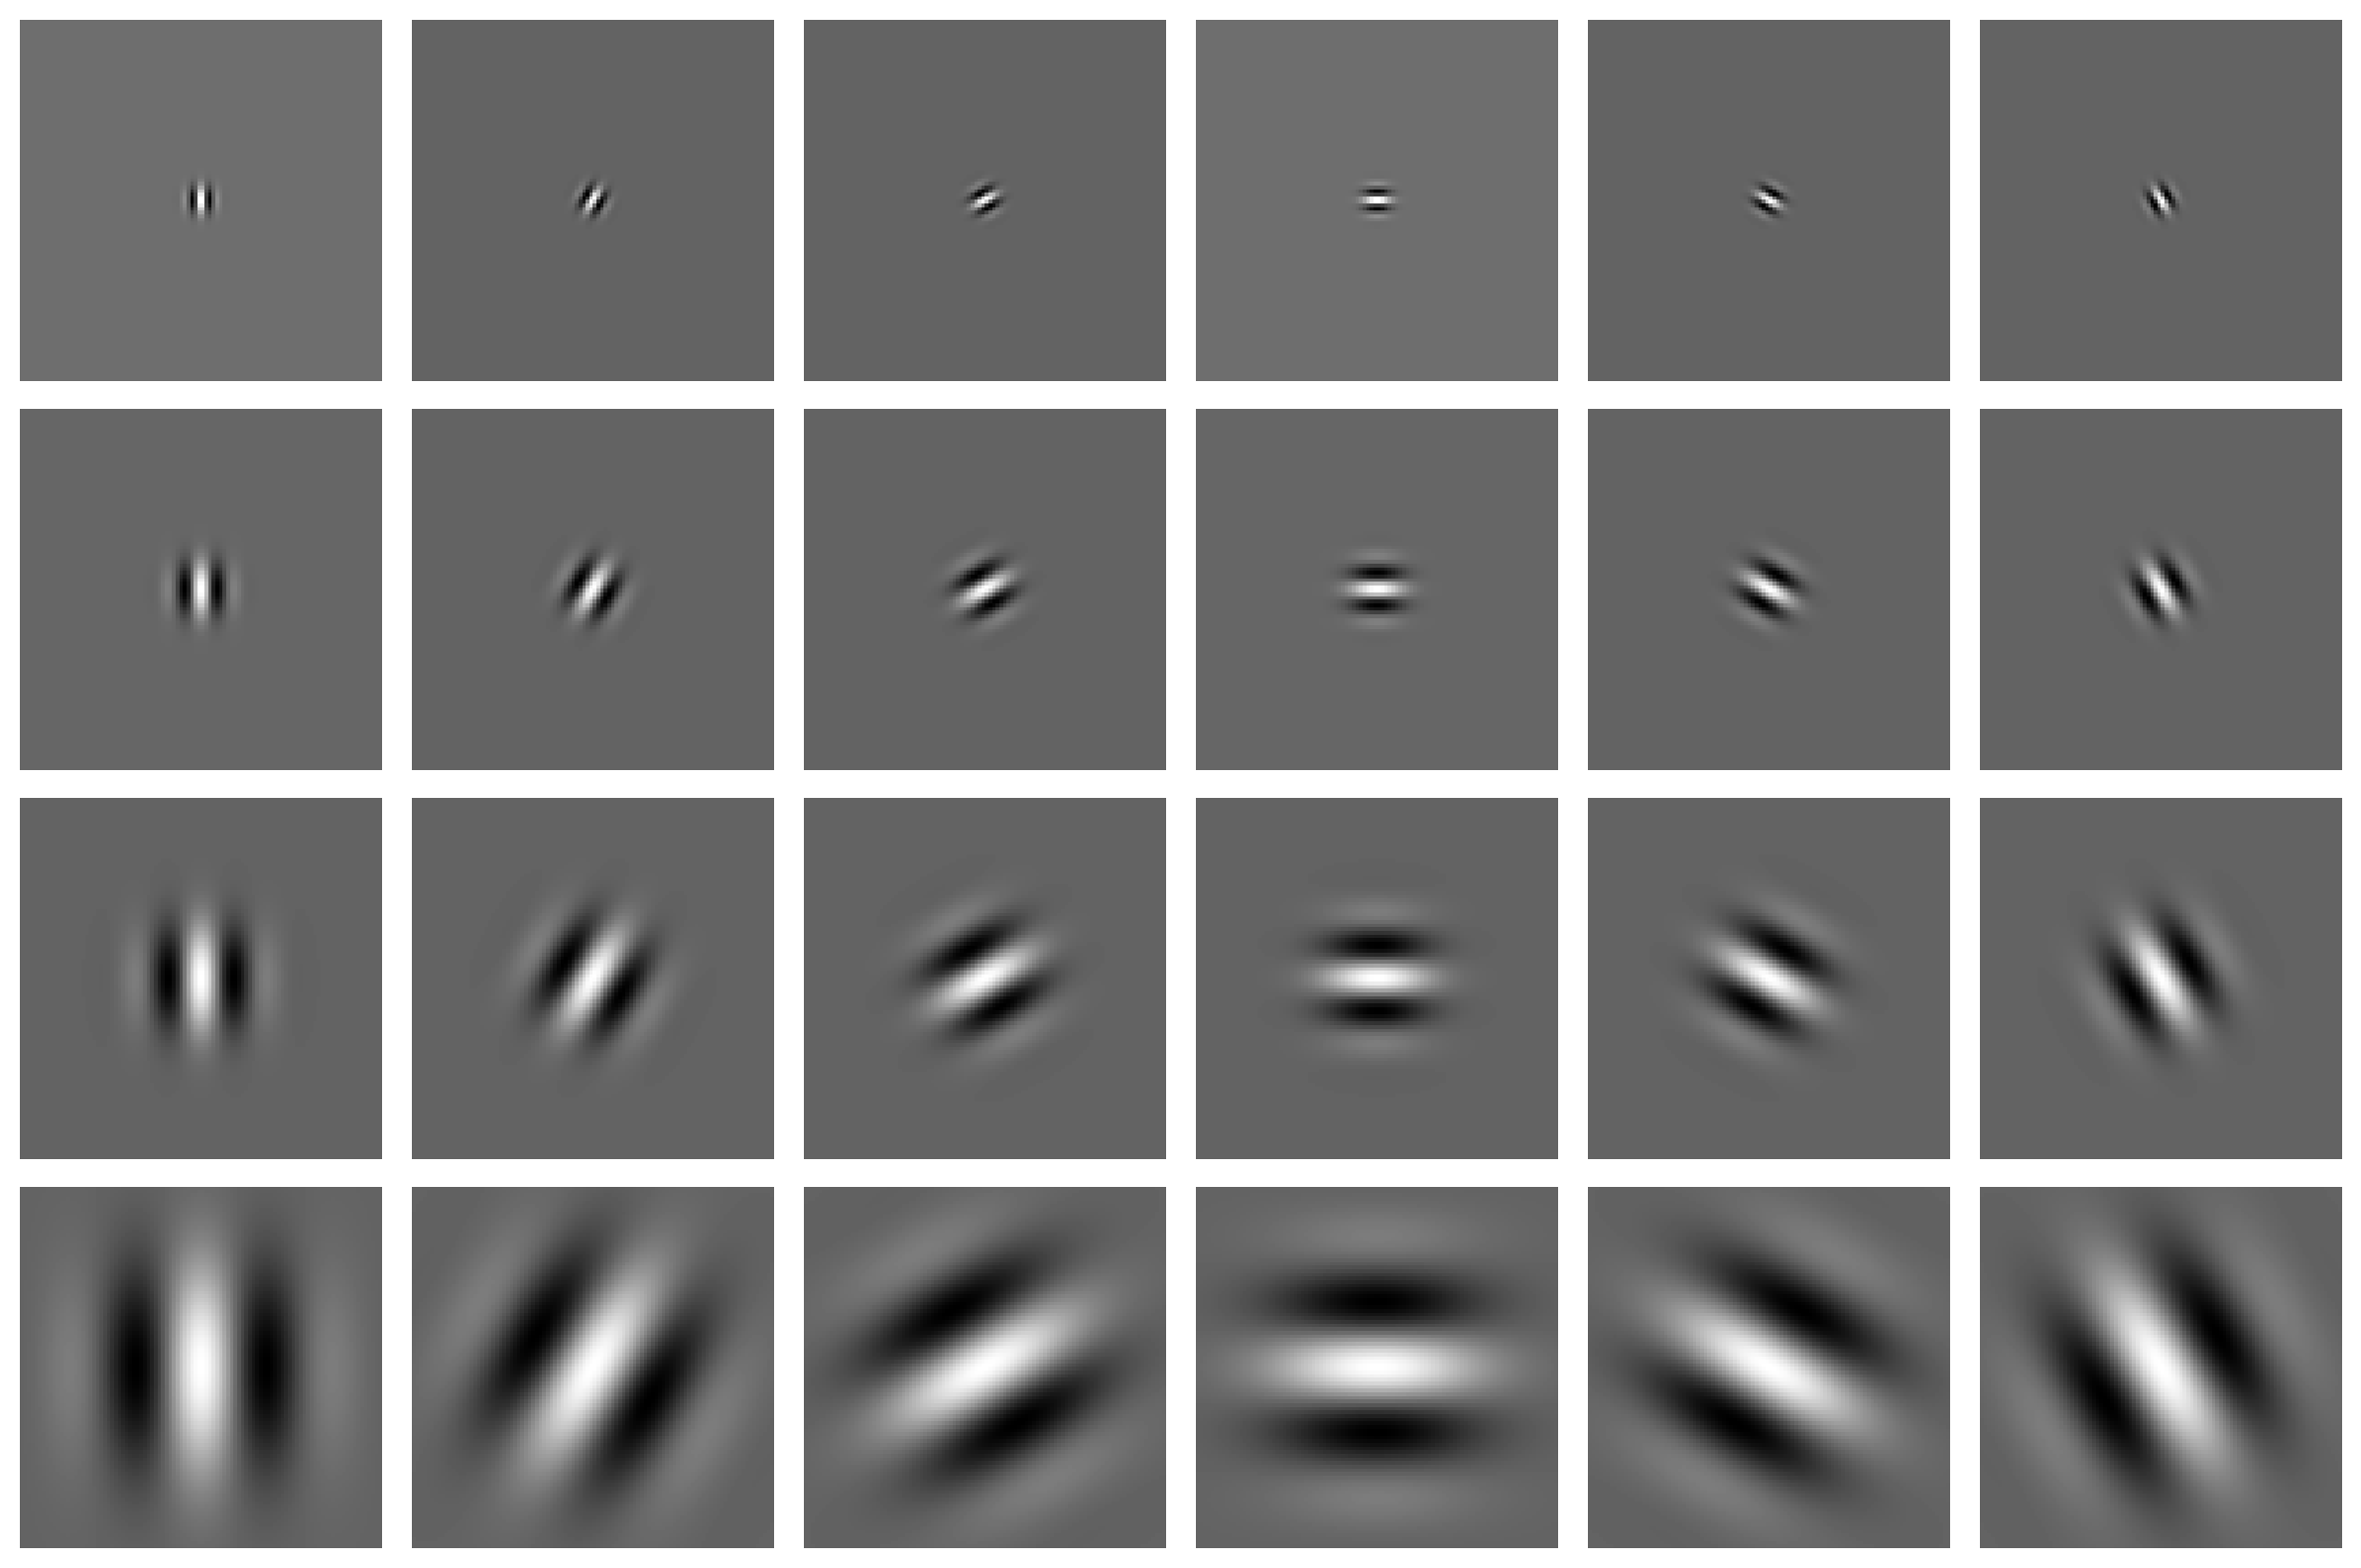
(Made in house by VCL 2025)
Gabor filters aid in object and facial recognition by extracting key features from images, transforming them into a series of wavelets that represent various image components. A Gabor is a sine wave modulated by a Gaussian function, where the Gaussian’s width defines the Gabor’s spatial extent (we usually would only want the wave pattern limited to a small area of the image so that it doesn’t affect the entirety of it). By combining multiple Gabors (vertical Gabors, horizontal Gabors, etc.), we can reconstruct an image, creating a weighted representation of its features. This approach allows us to build small models of the primary visual cortex, functioning like a multivariate regression to predict pixel values and reassemble the image.
What are Gabor wavelets inspired by?
Gabors were inspired by neurons called simple cells found in the visual cortex of the brain. It would be inefficient for every neuron in your visual cortex to be firing at all times when taking in visual information. So, neurons are specialized to only respond to visual stimuli that are in specific orientations (such as horizontal, vertical, or diagonal lines). Whenever there is a shift in the kinds of lines visible, this represents an edge. As mentioned above, Gabor wavelets are used frequently in computer vision to simulate the way a human may see and perceive information. In this sense, each of the Gabors we use to represent an image represents one of the visual neurons with its specific orientation, pattern, or texture that it can detect. We can use multiple Gabor wavelets to reconstruct an image in the same way your brain uses multiple specialized visual neurons to reconstruct a cohesive image of what you are seeing.
Further Reading
We recommend the following sources for more information on this topic:
Machine Vision MIT OpenCourseware. Note: this is a bit more advanced, but the content is excellent.
Practice Questions
- In the image below, what would the image look like if you filtered out all the low spatial frequencies so you were just left with high spatial frequencies and what would the image look like if you filtered out all of the high spatial frequencies?

- Phase-randomized images share an important property with their original counterparts. What is this property, and what does it mean for the visual appearance of the image?