11 Fourier Analysis
Fourier analysis is a method used to break down time series data into basic trigonometric functions, primarily sine and cosine waves. This technique helps transform complex signals into their frequency components, making it easier to analyze and identify underlying patterns in the data. In our lab, this is important both for analyzing the complex waveforms of EEG data, but also in doing basic image processing.
 (Made in house by VCL 2025)
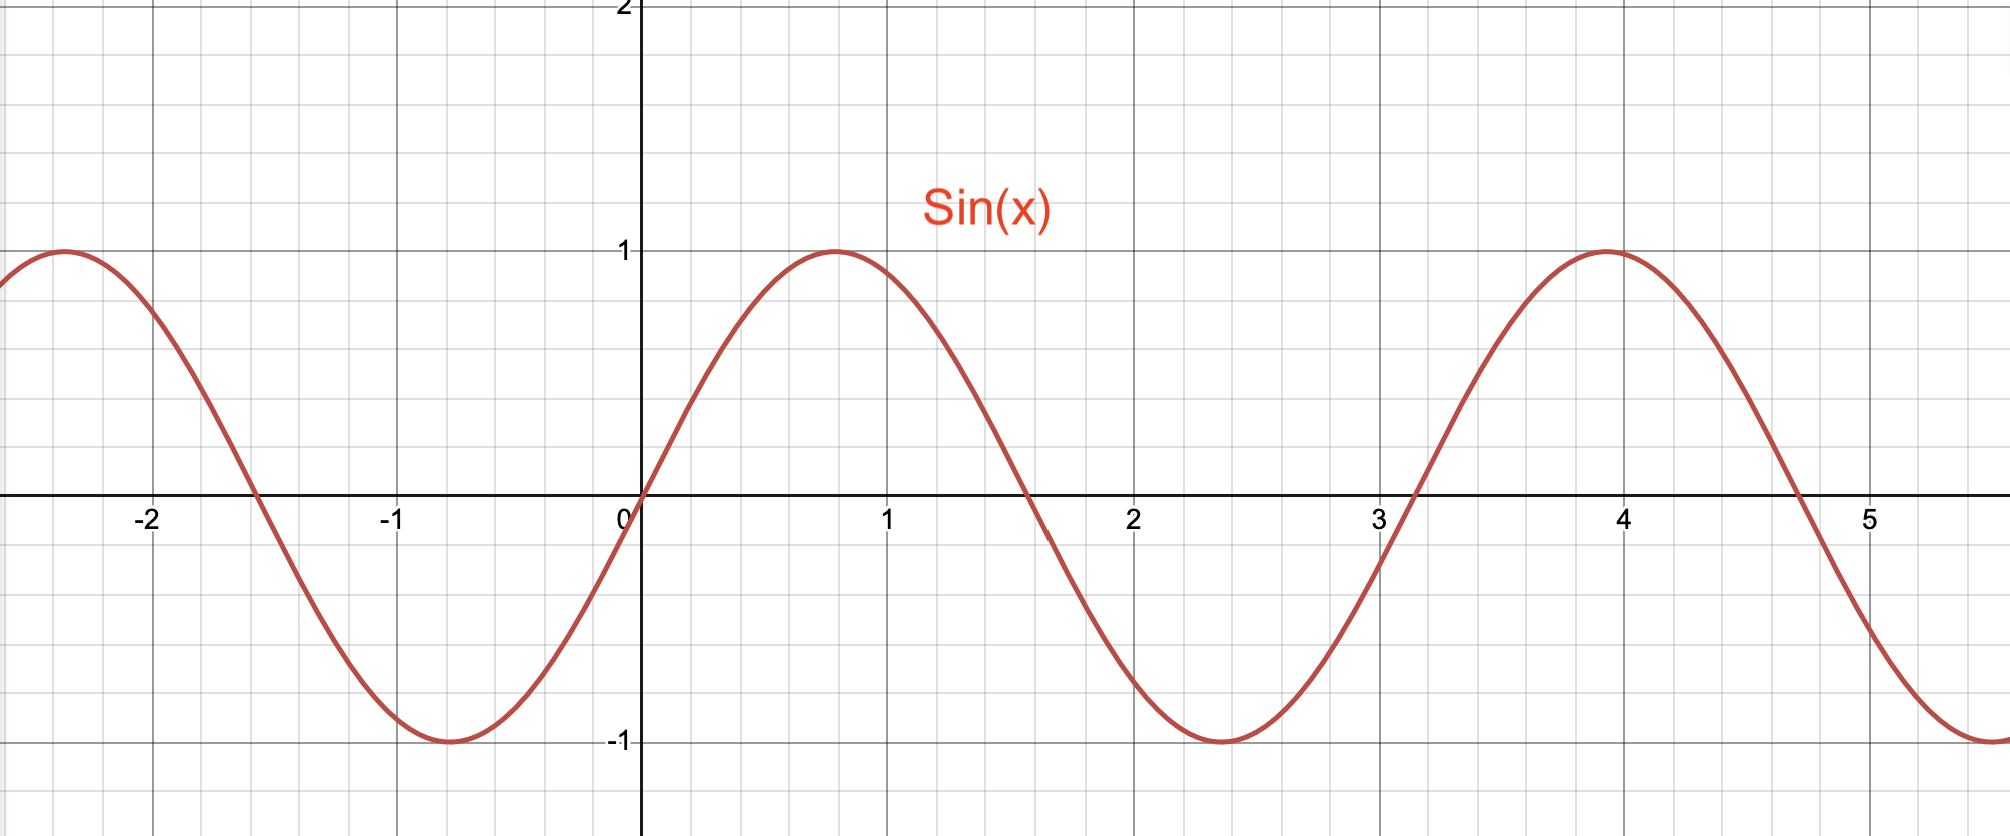
The above image is an example of a sine wave. A sine wave is defined by the equation y = sin(x). The curve is smooth and oscillates both above and below the x-axis. The period (the amount of time it takes to complete one wave cycle) is equal to two and the amplitude (the distance between the axis and the peak) is equal to 1.
(Made in house by VCL 2025)
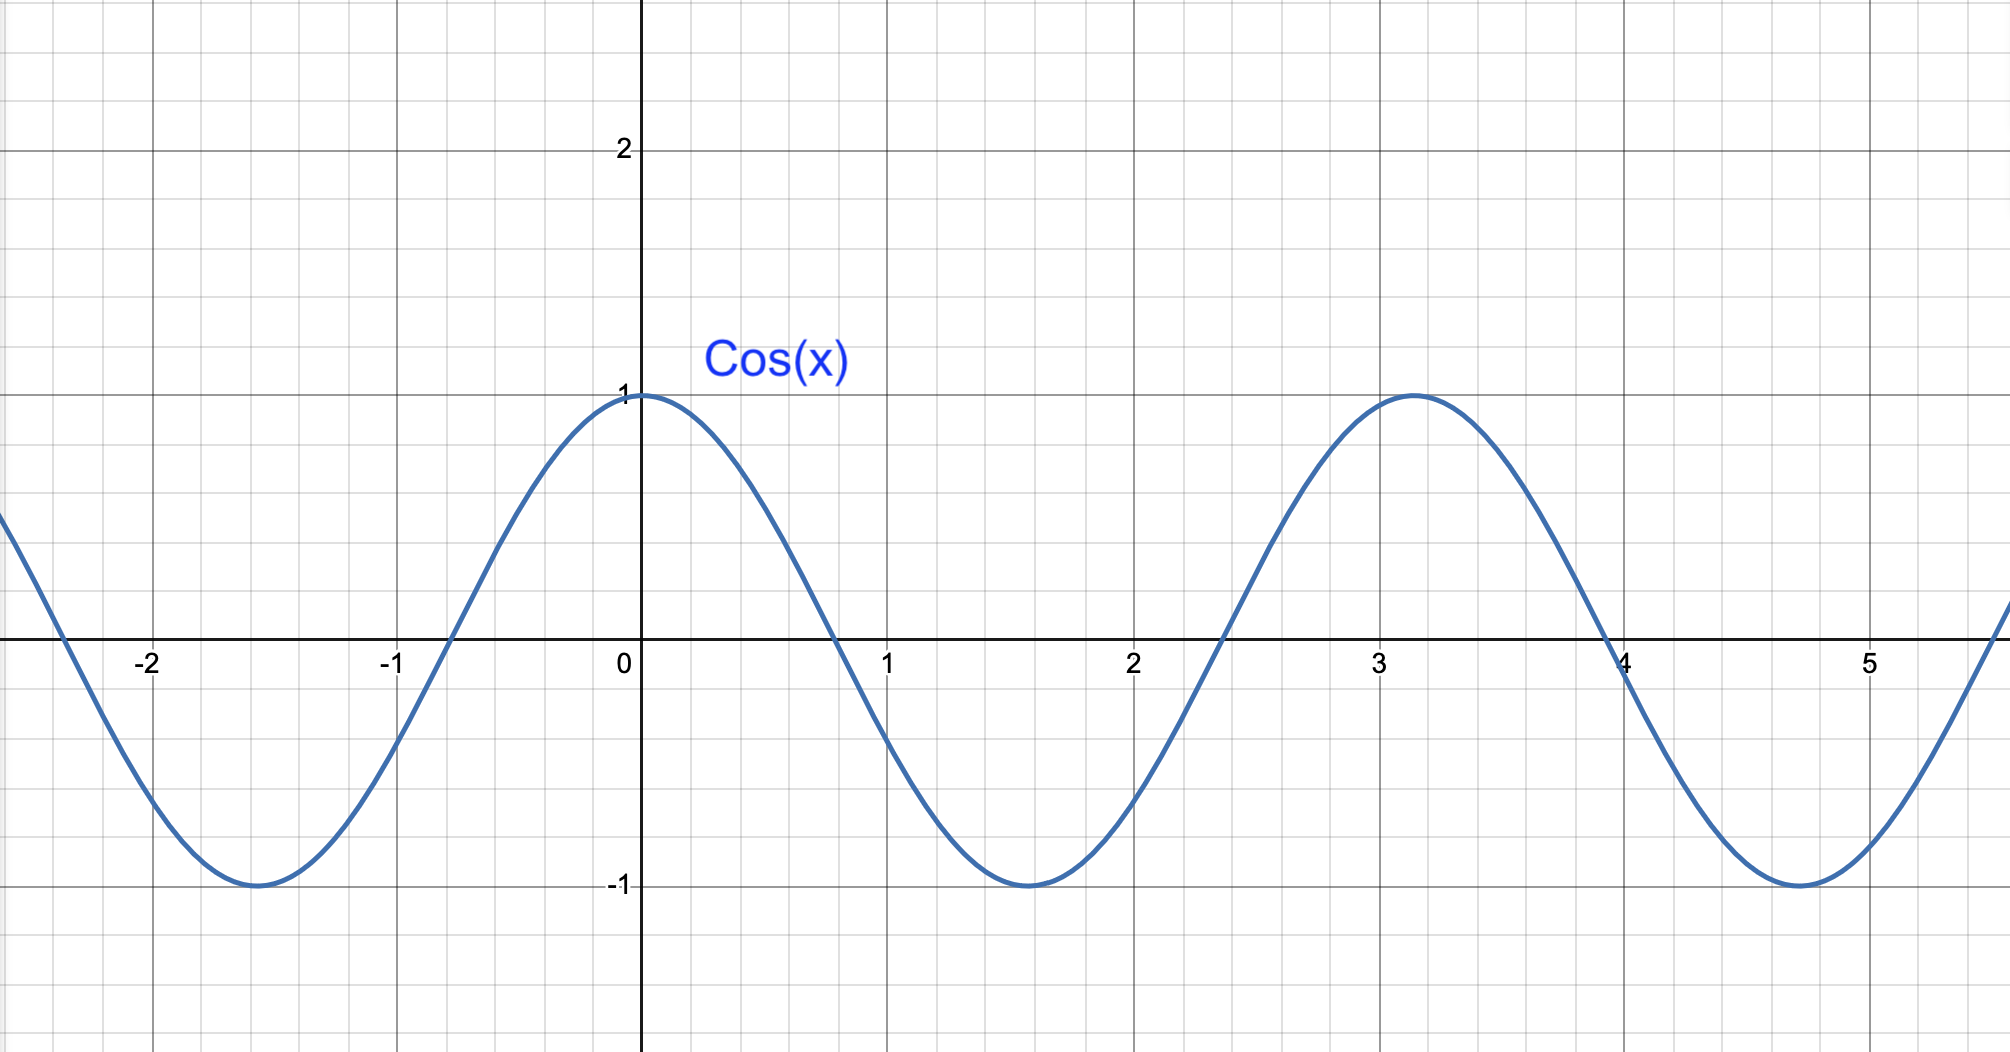
This is a diagram of a cosine wave. It’s equation is y = cos(x). Like the sine wave, the period (the amount of time it takes to complete one wave cycle) is equal to two and the amplitude (the distance between the axis and the peak) is equal to 1.
(Made in house by VCL 2025)
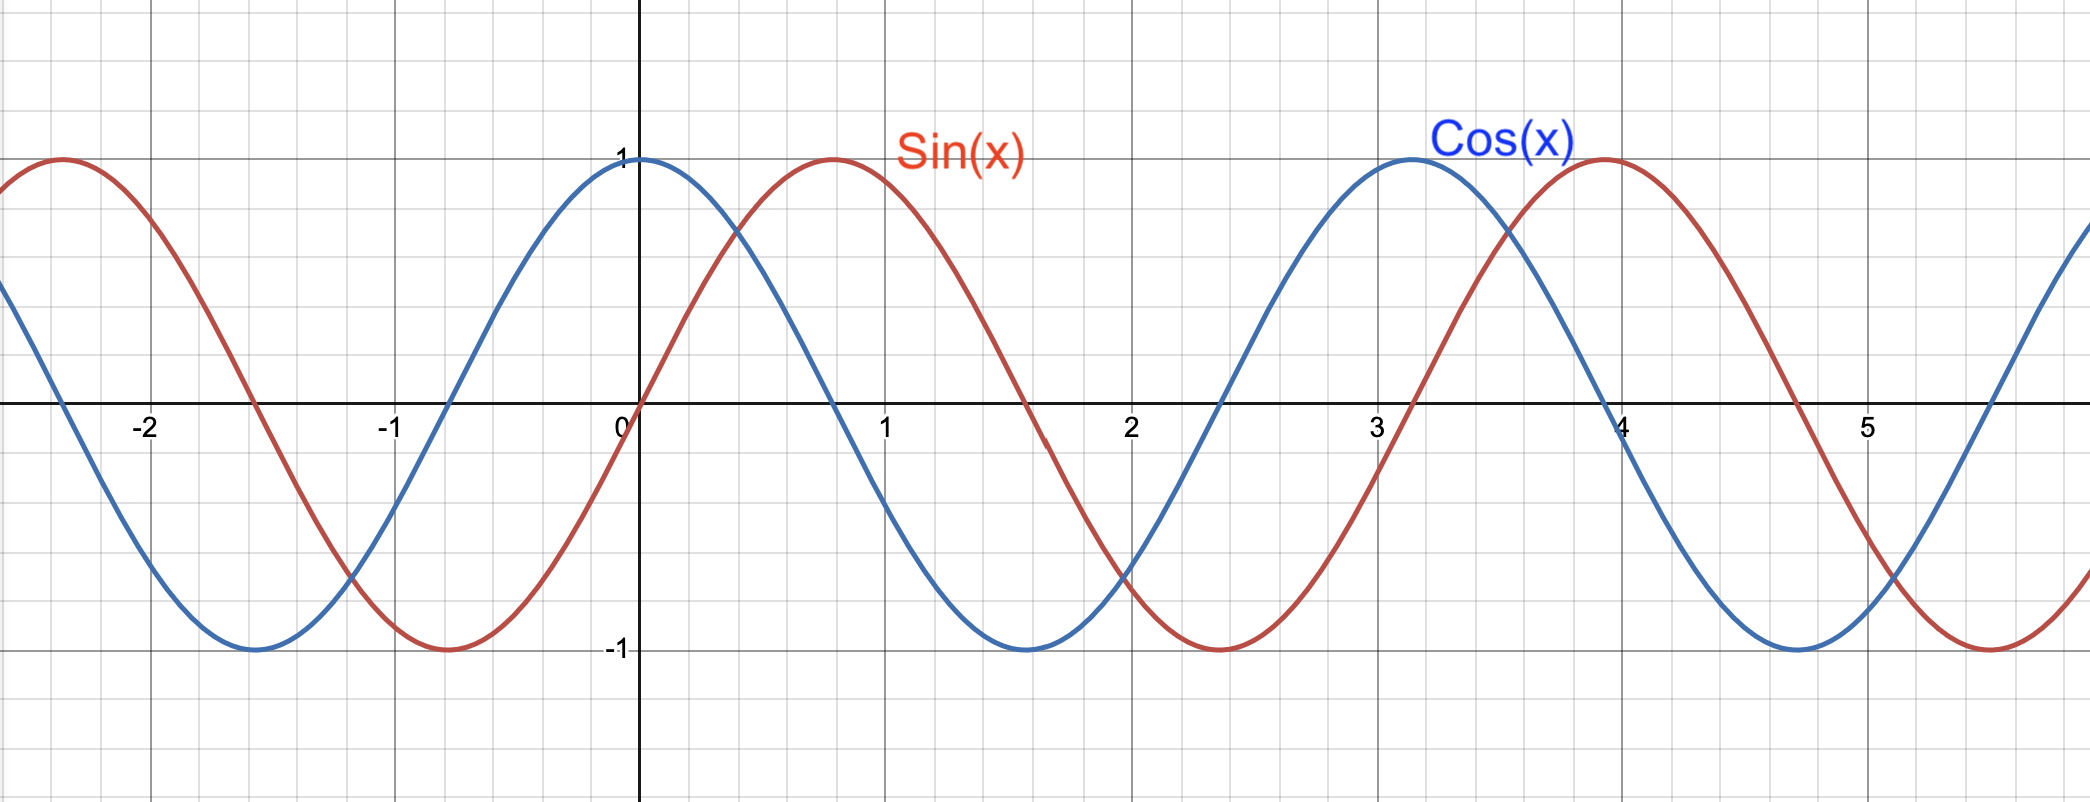
The graph above shows the difference between a cosine and sine wave. As you can see, the amplitude and periods are the equivalent, but the waves are 90 degrees (or π/2) apart. In other words, sine and cosine waves intersect with the x-axis a distance of π/2 apart from each other.
Time Domain vs. Frequency Domain Visualization
EEG data can be viewed and interpreted in two different ways: through a time domain or through a frequency domain. Viewing EEG data through the time domain is common; the x-axis represents time (typically in milliseconds) and the y-axis represents voltage. Voltage is pressure, the force of electricity.
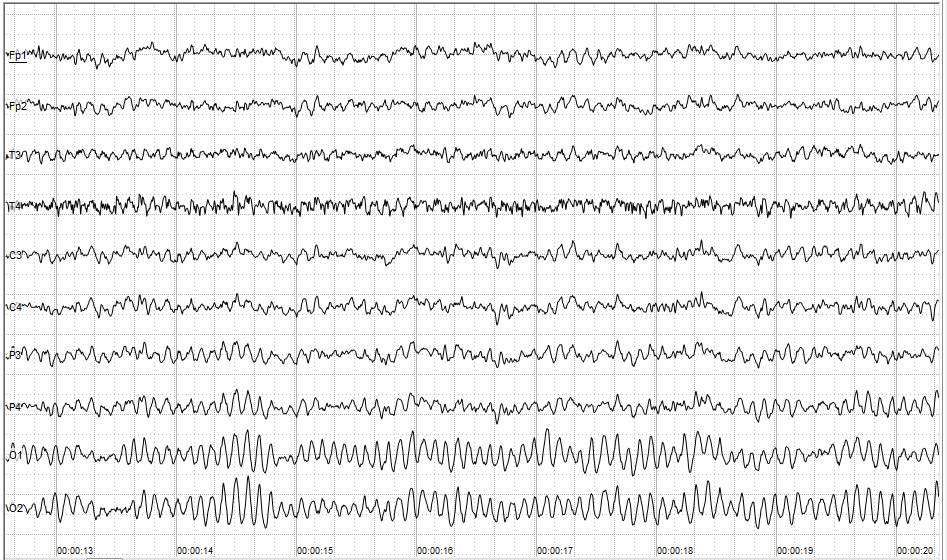
Time Domain EEG Graph. The x-axis represents time in milliseconds, labeled in 5 millisecond increments. The y-axis is specifying different channels and the amplitude of each channel is the voltage.
Fourier transformation is utilized when EEG data is viewed via the frequency domain. Any signal at a point in time can be broken down into a series of sine waves that vary in frequency, and amplitude.
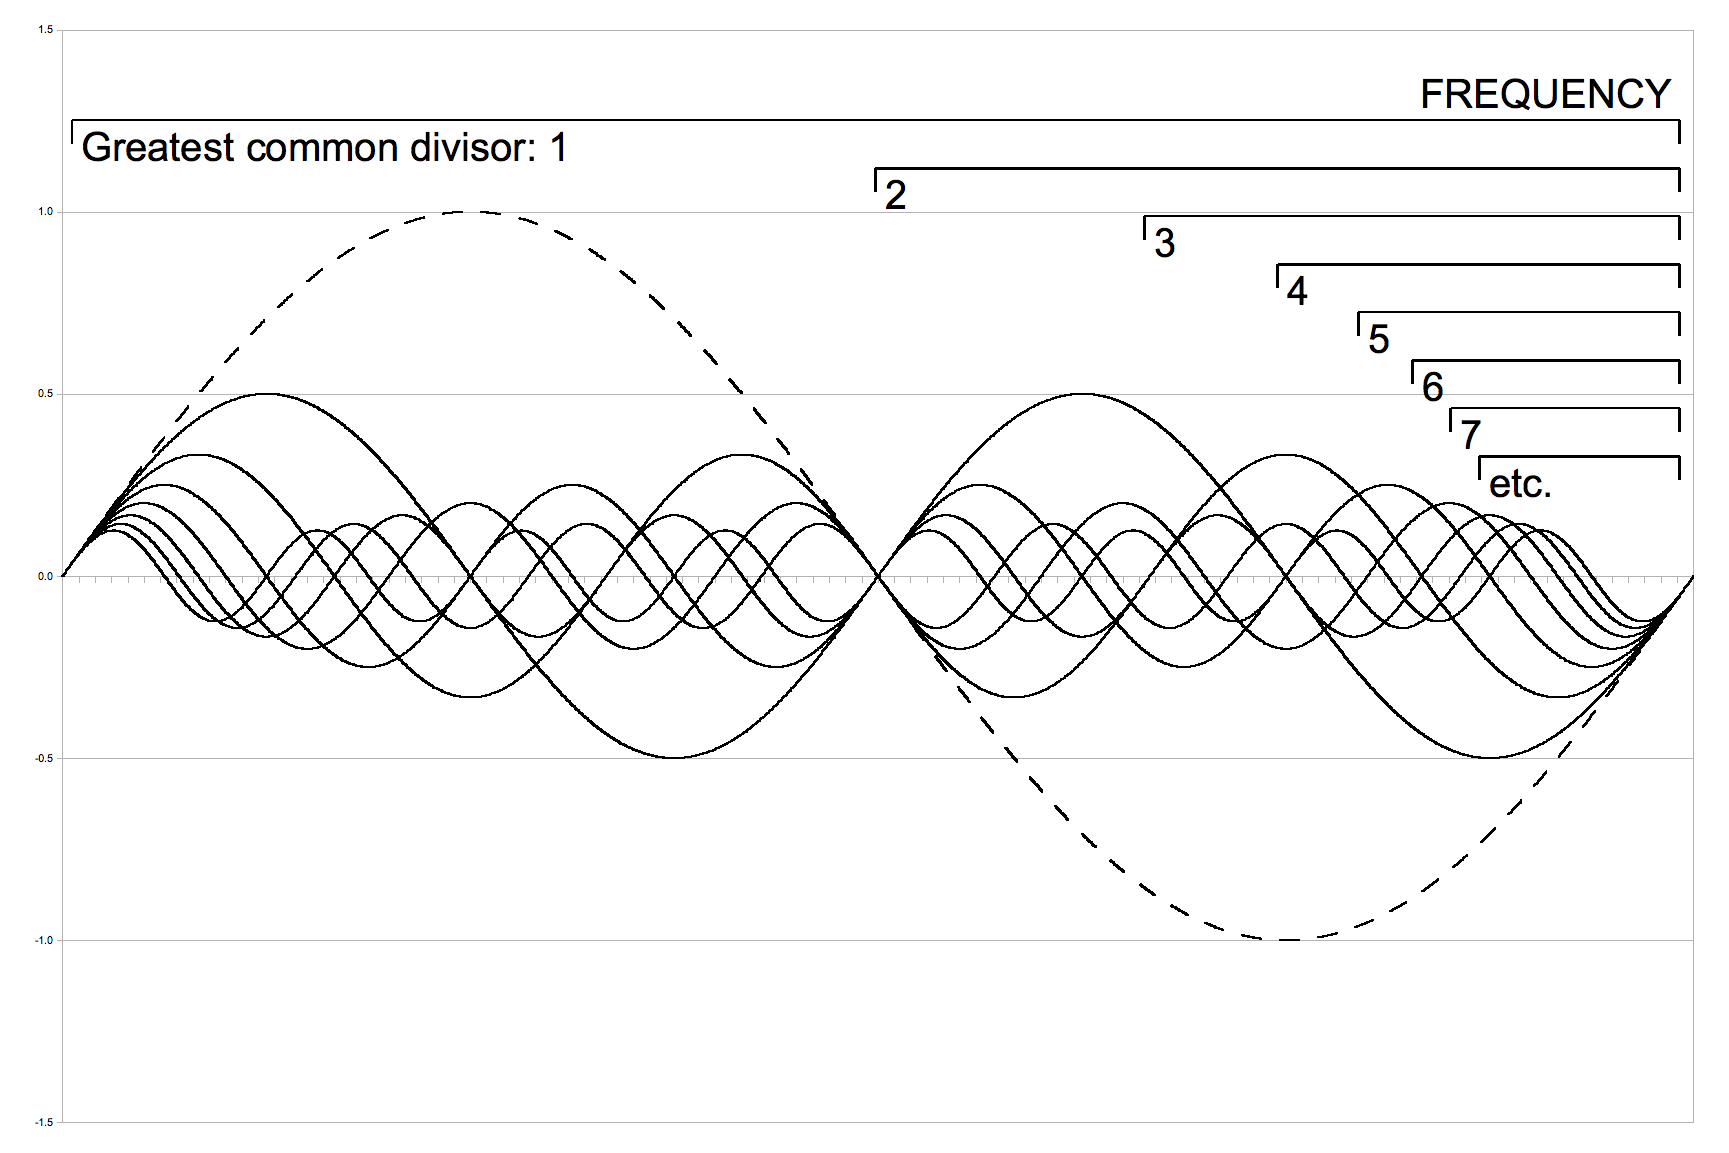
The figure above depicts what a broken down signal may look like and the individual sine waves that make up the original signal.
Fourier transformation estimates the amplitude (power) and frequency of each sine wave. This is then plotted in a frequency domain graph where frequency measured in Hertz is on the x-axis and amplitude is on the y-axis.
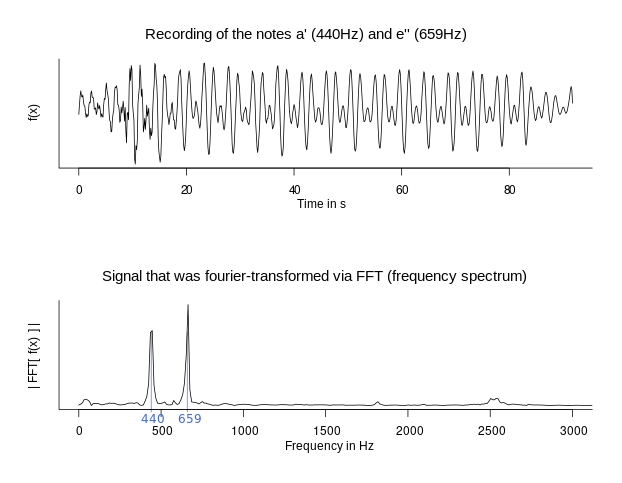
The wave in this image is depicting a signal made up of 440 Hz and 659 Hz notes. The graph under the wave shows the two distinct frequencies that makes up the signal. What makes the second graph different is that it’s represented in the form of frequency and amplitude rather than time and amplitude.
When analyzing and plotting EEG data using the frequency domain method instead of the time domain method, researchers are unable to extract power levels at specific time points for each frequency. The graph above illustrates the average power levels over the entire data window provided. As long as there is enough data to capture at least one full cycle—measured from the peak of one wave to the peak of the next—sine wave decomposition can be performed. Lower frequency data takes longer to complete a cycle. Frequency is measured in hertz (Hz), so a 2 Hz signal means the wave completes two cycles per second. As discussed in Chapter (ref?)(intro_eeg), electrical line noise is 60 Hz in the U.S. Fourier analysis allows us to measure how much line noise there is, and also helps us filter it out! This leads us to the next subsection, where we will break down why Fourier analysis is important in EEG experiments.
Relevance to EEG
By decomposing EEG waves into their subcomponents, we can better understand brain activity and more easily remove noise and artifacts—one of the main reasons researchers utilize fourier analysis in EEG experiments. Different wave frequencies reveal different aspects of brain function. For example, alpha waves (8-12 Hz), as discussed in the EEG section, often indicate that the participant is becoming drowsy. When preprocessing EEG data, it is important to filter out muscle movements and eye blinks before conducting Fourier analysis.
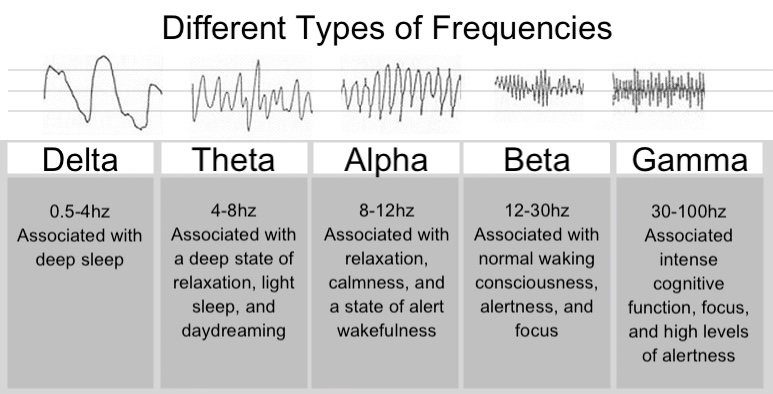
The image above illustrates various types of brain waves along with examples of activities likely to produce corresponding brain activity.
Amplitude and Phase Spectra
When we use Fourier analysis to break a complex signal (like a piano note) into its component frequencies, we aren’t just learning how much of each frequency is present—we’re also learning when each frequency wave starts, relative to the others. This second piece of information is called the phase.
You can think of the Fourier transform as producing two complementary “maps” of the signal:
The amplitude spectrum tells us how strong or loud each frequency component is. We’ve already seen this: a piano note’s amplitude spectrum might show peaks at the fundamental frequency and its harmonics, revealing which pitches make up the sound.
The phase spectrum tells us the timing offset of each frequency component. Essentially, where in its cycle the sine wave for that frequency starts. Is it peaking right at the start of the note? Is it shifted a quarter-cycle later? This matters because when we add all these sine waves back together, their relative timing (phase) determines the shape of the resulting waveform.
Here’s a simple analogy: Imagine a group of children on swings, all swinging back and forth at different rates (frequencies). The amplitude tells you how high each child is swinging, and the phase tells you where each child is in their swing at a given moment (just starting forward, at the top of the arc, etc.). If all the swings are in sync, you see a very regular pattern. If they’re out of sync, the pattern looks more jumbled—even though the swinging frequencies themselves haven’t changed.
In sound, amplitude determines what we hear as the pitch and loudness, while phase affects the shape of the waveform, which can subtly influence the sound’s character or clarity. In EEG, the amplitude determines the dominant frequency of neural oscillations, while the phase shows when these oscillations take place.
Further Reading
We recommend the following sources for more information on this topic:
Allen B. Downey Think DSP: Digital Signal Processing in Python.
Practice Questions
Why would we want to decompose an EEG signal into its individual frequencies during preprocessing?
What is the difference between the time and frequency domain?
Would we say 2Hz or 2Hz per second when describing oscillation frequency? Why?
What two spectrums are produced by Fourier transform? How do they complement one another?